
Automated evaluation and generation of calibration curves for many compounds at the same time
Generating well-defined calibration curves is crucial for accurate quantitation by chromatographic methods. With Chrom Cal, this error-prone and time-consuming process can be fully automated and streamlined on multiple compounds at the same time!
When executed, Chrom Cal will:
- Automatically retrieve spectral datasets for processing and analysis
- Plot the integration areas against the known analyte concentrations
- Carry out statistical (regression) analysis to correctly fit the calibration line
- Evaluate and validate the results following pre-set acceptance criteria
- And finally, generate automatic reports and result files that can be used for downstream quantitations.

Gears Chrom Cal
Highlights
Help & Resources
Gears Chrom Cal
Features
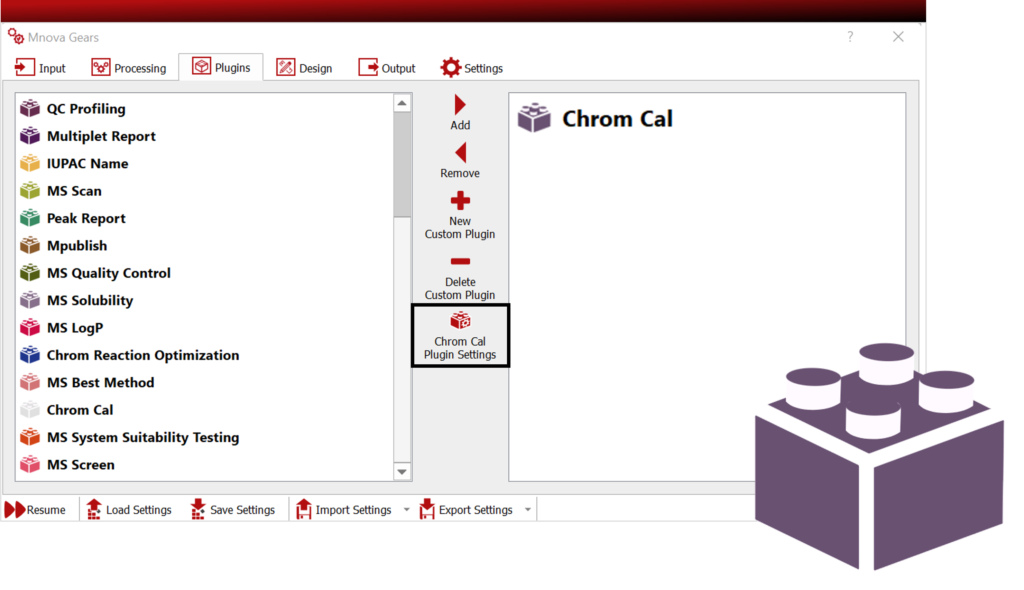
Chrom Cal is fully integrated in Mnova and therefore can handle spectral datasets and extract the information needed for calculating the calibration curves without the need for data transcription into third party software or spreadsheets.
After data ingestion, Chrom Cal can detect and group the samples from different compounds automatically based on an input csv file, and calibration curves for those compounds can be generated in a single run.

Chrom Cal relies on a powerful algorithm to process spectral data, integrate compound peaks, and fit the calibration curve to the data points in a fully automated fashion.
Acceptance criteria, such as R2 value threshold or slope range, and cross-validation rules can be pre-defined in the method and evaluated at the end of the analysis to approve or reject the calibration results. This allows you to keep control over the quality and linearity of the results and speeds up the results reviewing process.

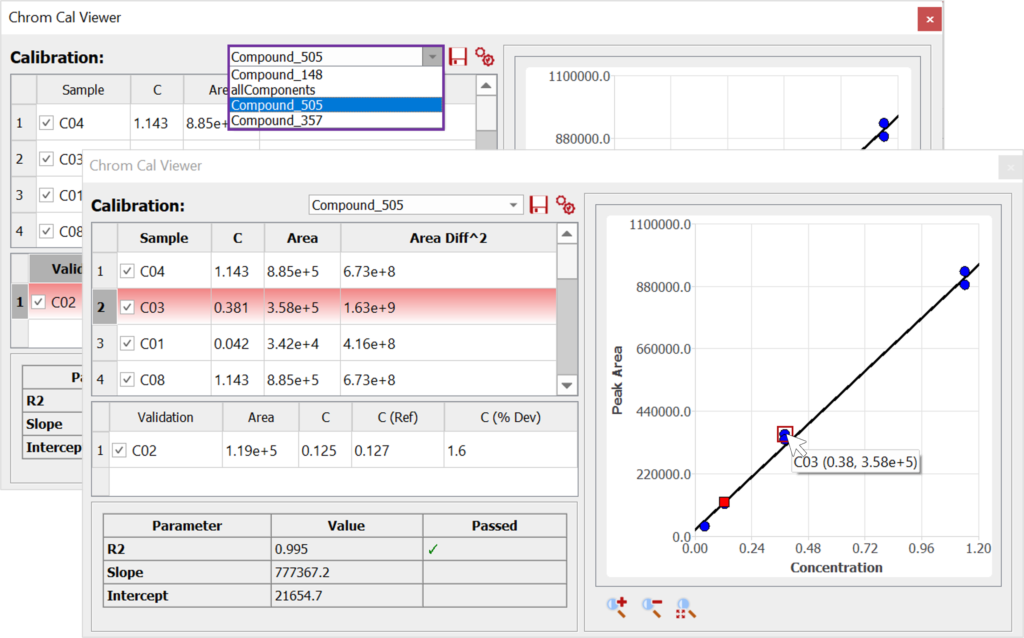
Calibration and validation results are displayed in a result viewer that allows both global and more detailed review of the data.
You can easily navigate between compounds to check the standard curve plots and parameters. Each data point on the graph is dynamically linked to the results tables and spectra. You can zoom in or out on the plot, include or exclude samples from the analysis, or even correct peak assignment or integration when needed, and the results are automatically recalculated.
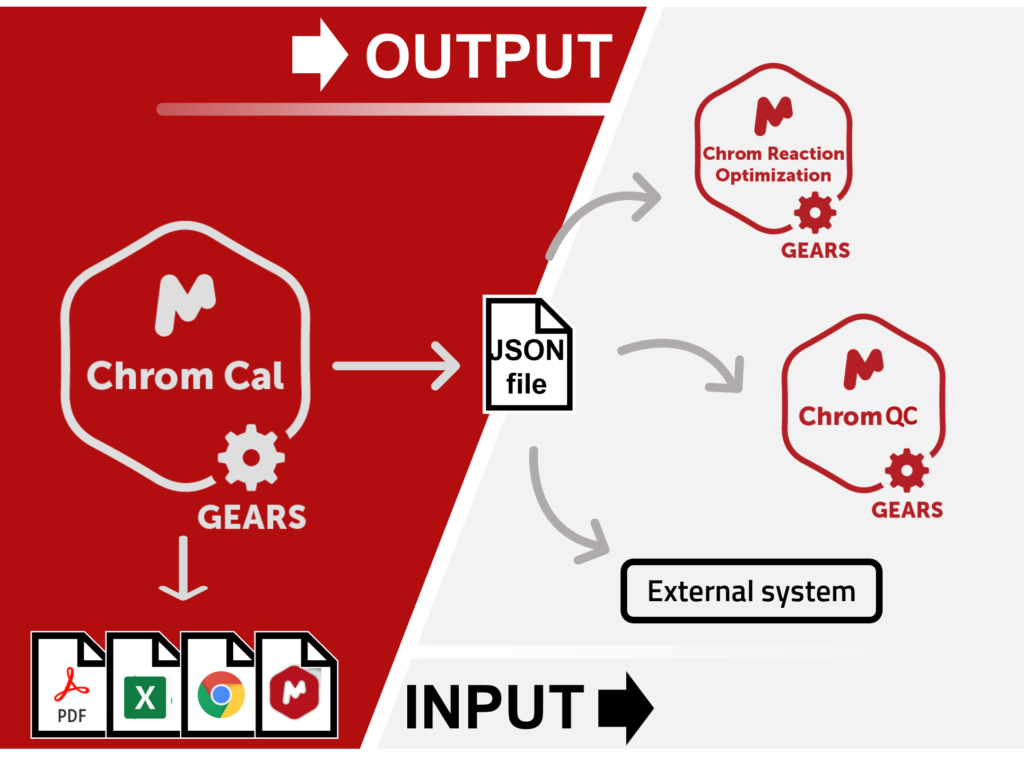
Automatic CSV, Mnova, and PDF reports are generated with the calibration and validation results for each compound and are saved in the chosen location on your disks or databases along with a global HTML report and other metadata, log, and settings files. This saves a lot of time and considerably improves data management practices within your organization as it makes data easily findable and reusable.
Compound calibration results are also included in “.json” files that can feed downstream quantitative analyses performed by other Mgears plugins or by external software. Calibration values are extracted from these files and used for quantitation with no need for manual transcription, an error-prone and time-consuming task.
Academic, Government & Industrial
Markets
Who should be using Chrom Cal
Organic chemists, Analysts, QC experts, NMR spectroscopists, and researchers using quantitative chromatographic methods for quality control, concentration/purity determination, or monitoring/optimization of reactions in one of the following markets:
- (bio)Pharmaceutical industry
- Food & Bev industries
- Personal care and Cosmetics industries
- Fine chemical synthesis industries
- Polymers industries
- Academic research laboratories


